Anyone that’s spent time with the waves will know of two important variables that account for how powerful they are. The two variables? The size of the swell and the gap or interval between the waves.
Put simply, the bigger the swell, the bigger the wave. And the longer the gap or interval between the waves, the more power the wave has. Tidey now displays both of these variables at your local beach. The examples below show some how it works.
- How to read the Wave height: The longer the wave on screen, the bigger the wave on the beach: each little square in the length of wave is equal to approximately 1 foot in wave height.
- How to read Wave Interval: The waves on screen are appearing at the same frequency as they are crashing on the beach in real-life. The gap in seconds between the waves appearing on the screen is the actual gap in seconds between the waves on the beach.
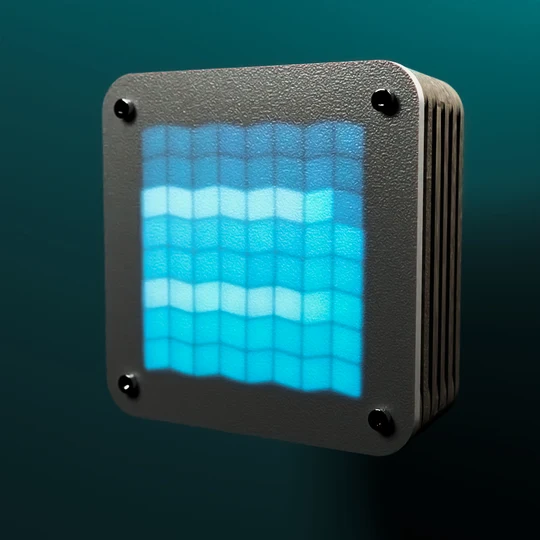
The gap between each wave is about 6 seconds. You can count the time between them as they appear from the top right.
The wave direction tells us that tide is going out, the animation is moving from top right down to bottom left.
7′ x 7s = These waves are fairly strong, they should be good conditions for a surf session.
The Tide is going out, the waves are going from top right down to bottom left.
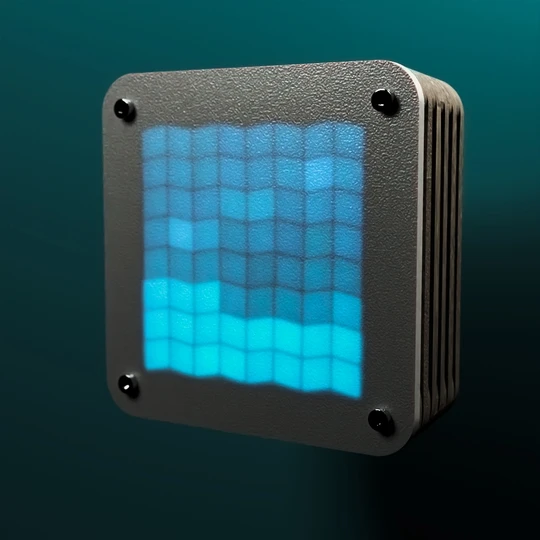
1′ x 3s = These are not surfing conditions, it looks like its flat – good for a swim probably.
The tide is going in: the waves are travelling from bottom left up to top right. It’s nearly high tide.
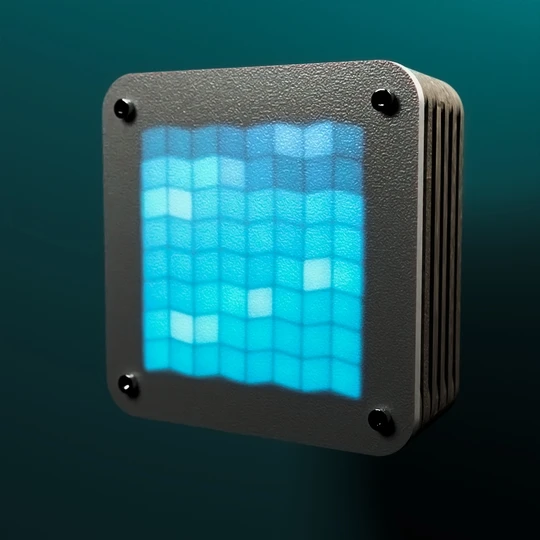
2′ x 3s = The water is fairly calm.
It’s approaching low tide, tide is going out.
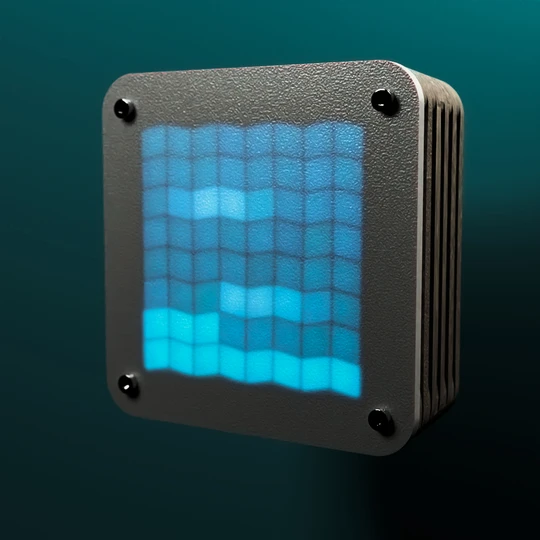
3′ x 7s = The conditions here should be not bad for a fun surf.
In summary: the more frequent the waves on screen, the weaker they are. The shorter the waves, the smaller they are. Long waves with big gaps between them = bigger waves. Surfs up!
Of course there are a lot of other factors that will determine the actual conditions on the beach, we’re not displaying swell direction, or wind strength for example which can also have a huge impact. But this display will give you a good visual idea of what’s happening – if you want ALL the data to pinpoint your precise needs, you’ll need your favourite surf or wind app to tell you more.
Give it a try: log onto https://cloud.tidey.co and select ‘Wave Height and Interval’ from the drop-down in your dashboard.